![]() Ola
Fremming's homepage
Ola
Fremming's homepage
|
|
|
|
Lolo Display A Windows software made to be able to download and handle data logged by a LoLo-logger, without the need for running Excel. The downloadable file is a self-extracting .EXE-file containing the install files. Store the file in a temporary folder, run it to extract the install files. Then run Setup.exe to install LoLo-display on Your computer. Reports from users indicates that the reduced download-time compared to the Excel-macro is appreciated. The software has been reported to successfully run on Win98, WinMe and Win2000 Prof. It even works with a USB to serial adapter from 'USB GEAR'. Requests : Please feel free to suggest enhancements to the SW, as stated earlier I will not relate to any deadline for implementation, but features not suggested will perhaps NEVER be implemented.
Upgrades to Rev 01.0 (28 June 2003) : - Export and import of datablocks has been finalized. The file format of the exported blocks has been slightly altered (header line) to cope with different settings. - Possible to select up to COM8 for LoLo connection. Needed when using some USB-RS232 converters. Upgrades to Rev 00.5 (2 Dec 2002) : - A download limit of 50k-bytes has been changed to 100k. Related to download of very long sequences.
Upgrades to Rev 00.4 : - The user interface is made scalable in size, try it !
Upgrades to Rev 00.3 : - Configurable altitude in Meters or Feet. - Install dialog in English, not Norwegian ! - Possibility to enable or disable beeping when downloading - Export of a block of data to file; file format changed from space separated values, to tab separation. This enables easier imports to other SW.
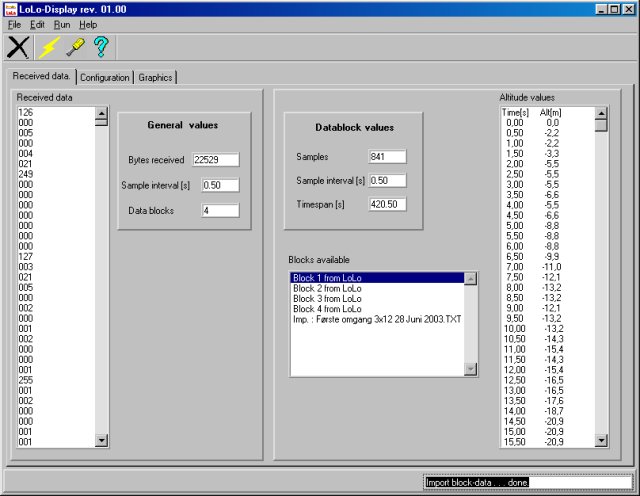
Download the newest LoLo-Display install file. Screenshots
As can be seen, 4 blocks has been downloaded from LoLo, and one block that is imported from a file previously exported.
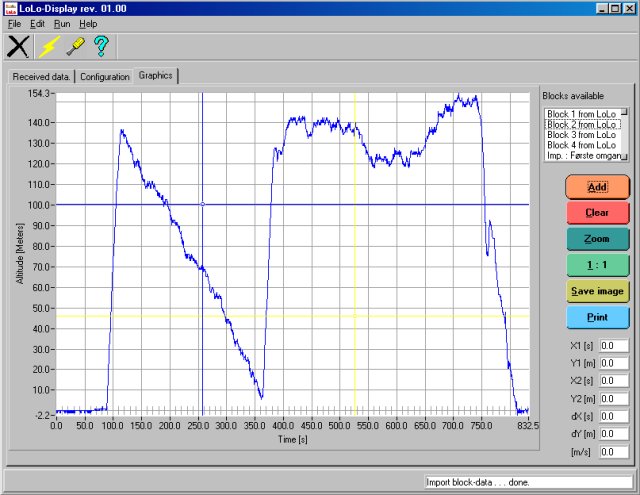
The graph shown is one round from a electric glider competition attended. First climb to 135 meter into bad air, second climb to 125m into thermals before diving in for landing at the specified 12minute duration.
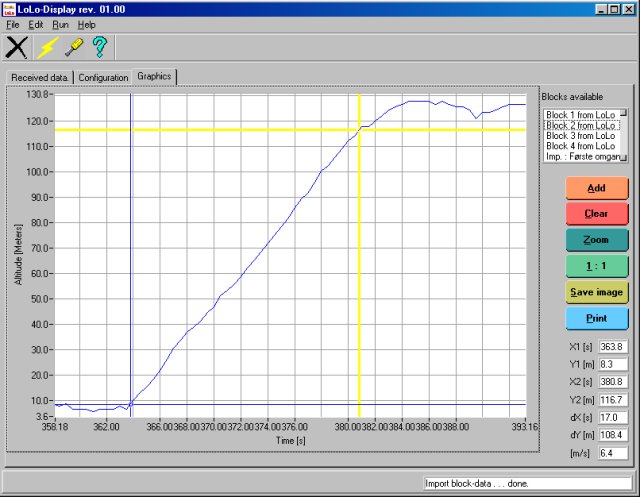
This is from the same competition with my electric glider. A climb-rate of an average of 6.4m/s from 5 to 130m altitude. |